Europe
Asia - Australasia
Americas
Middle East - Africa
CHEMISTRIES
ONLINE INSTRUMENTS
INSTRUMENT TYPE
PICK & SHIP
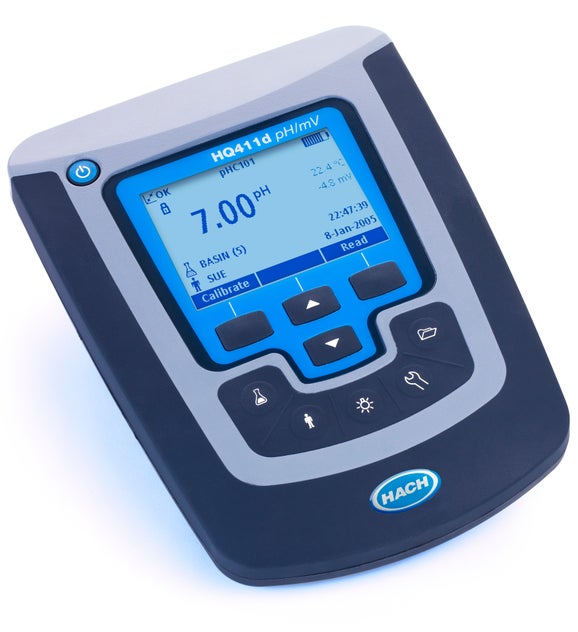
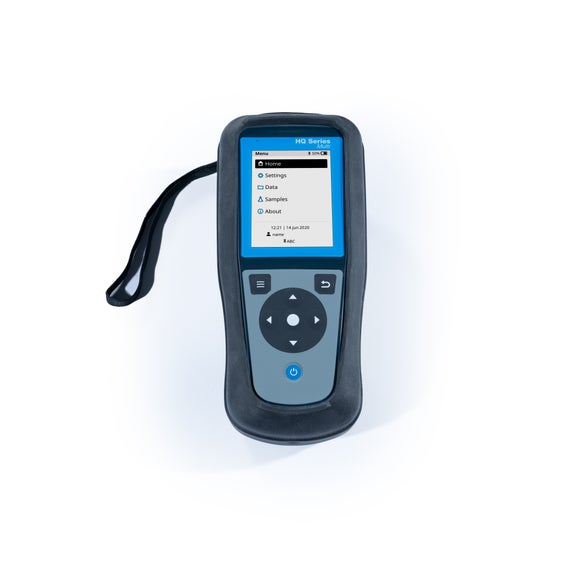
LAB & PORTABLE INSTRUMENTS
SAMPLERS
DIGITAL SOLUTIONS
PRODUCT ANNOUNCEMENTS
LAB EQUIPMENT & SUPPLY
PRODUCTS- 10th BLANK
SERVICE PRODUCTS
PROMOTIONS
PRODUCTS- 13th BLANK
PRODUCTS- 14th BLANK
Product Directory
TRAINING PRODUCTS
Blank 16
Blank 17
Ships Next Day
Blank 18
FEATURED PARAMETERS
Param2nd blank
LEARN MORE ABOUT WATER QUALITY CHEMISTRIES
param 5 - blank
param 6 - blank
View all Hach Parameters
param 10 - blank
param 11 - blank
param 12 - blank
WATER ANALYSIS HANDBOOK
param 14 - blank
param 15 - blank
param 16 - blank
param 18 - blank
MUNICIPAL
INDUSTRIAL
APPLICATIONS
BROWSE BY TOPIC
INDUSTRIES - 5th BLANK
INDUSTRIES - 6th BLANK
ENGINEERING CONSULTANTS
CLAROS WATER INTELLIGENCE SYSTEM
YOUR CHALLENGES
CLAROS RESOURCES
QUICK LINKS
Aquatic Informatics
SUPPORT
SERVICE
TRAINING CENTER
INFORMATION CENTER
SUPPORT - blank 5th spot
Engineering Resource Library
TRADESHOWS AND EVENTS
Successfully added to cart
Browse by
No Results
Product Number: